Prosecution insights in an instant
Filing trends, growth areas and firm relationships for every company and law firm, pulled the moment you search. Everything you need before your next pitch, without the research.
Work email required. No credit card needed.
57 million patent applications · 52 patent offices · updated weekly
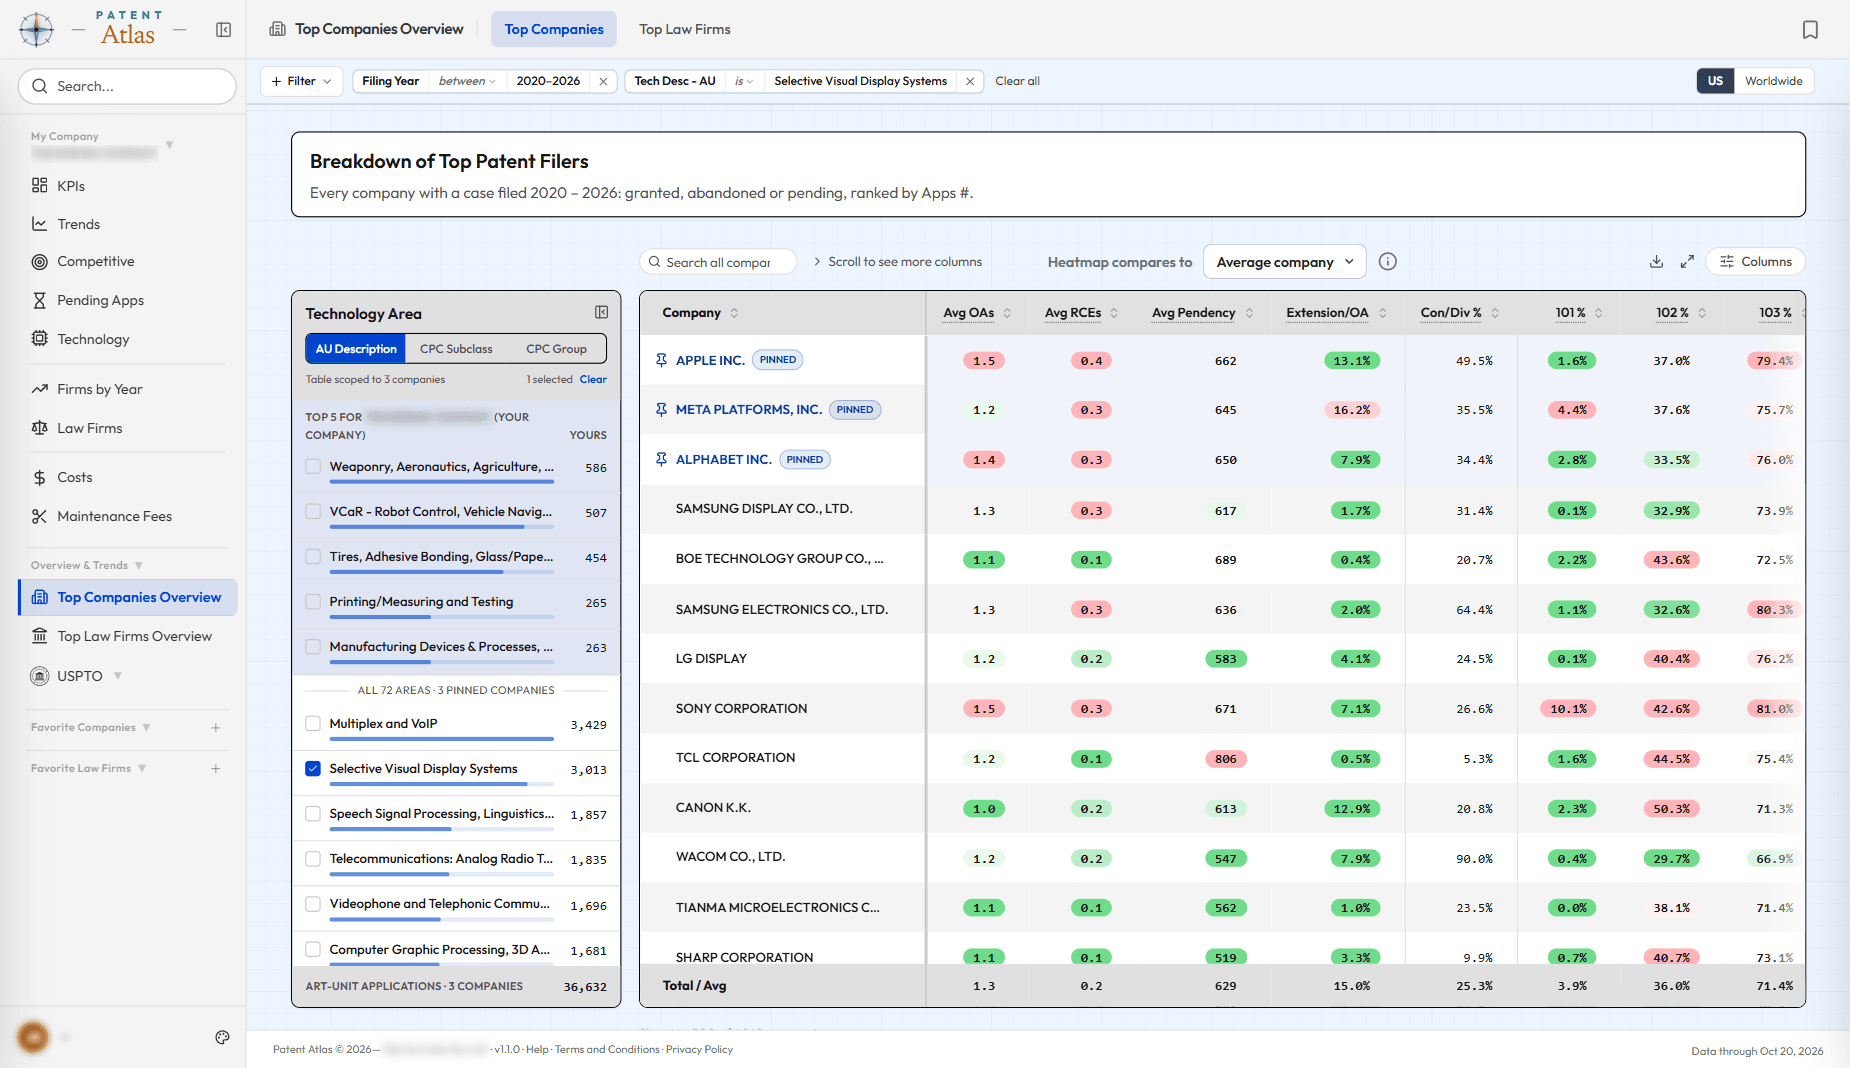
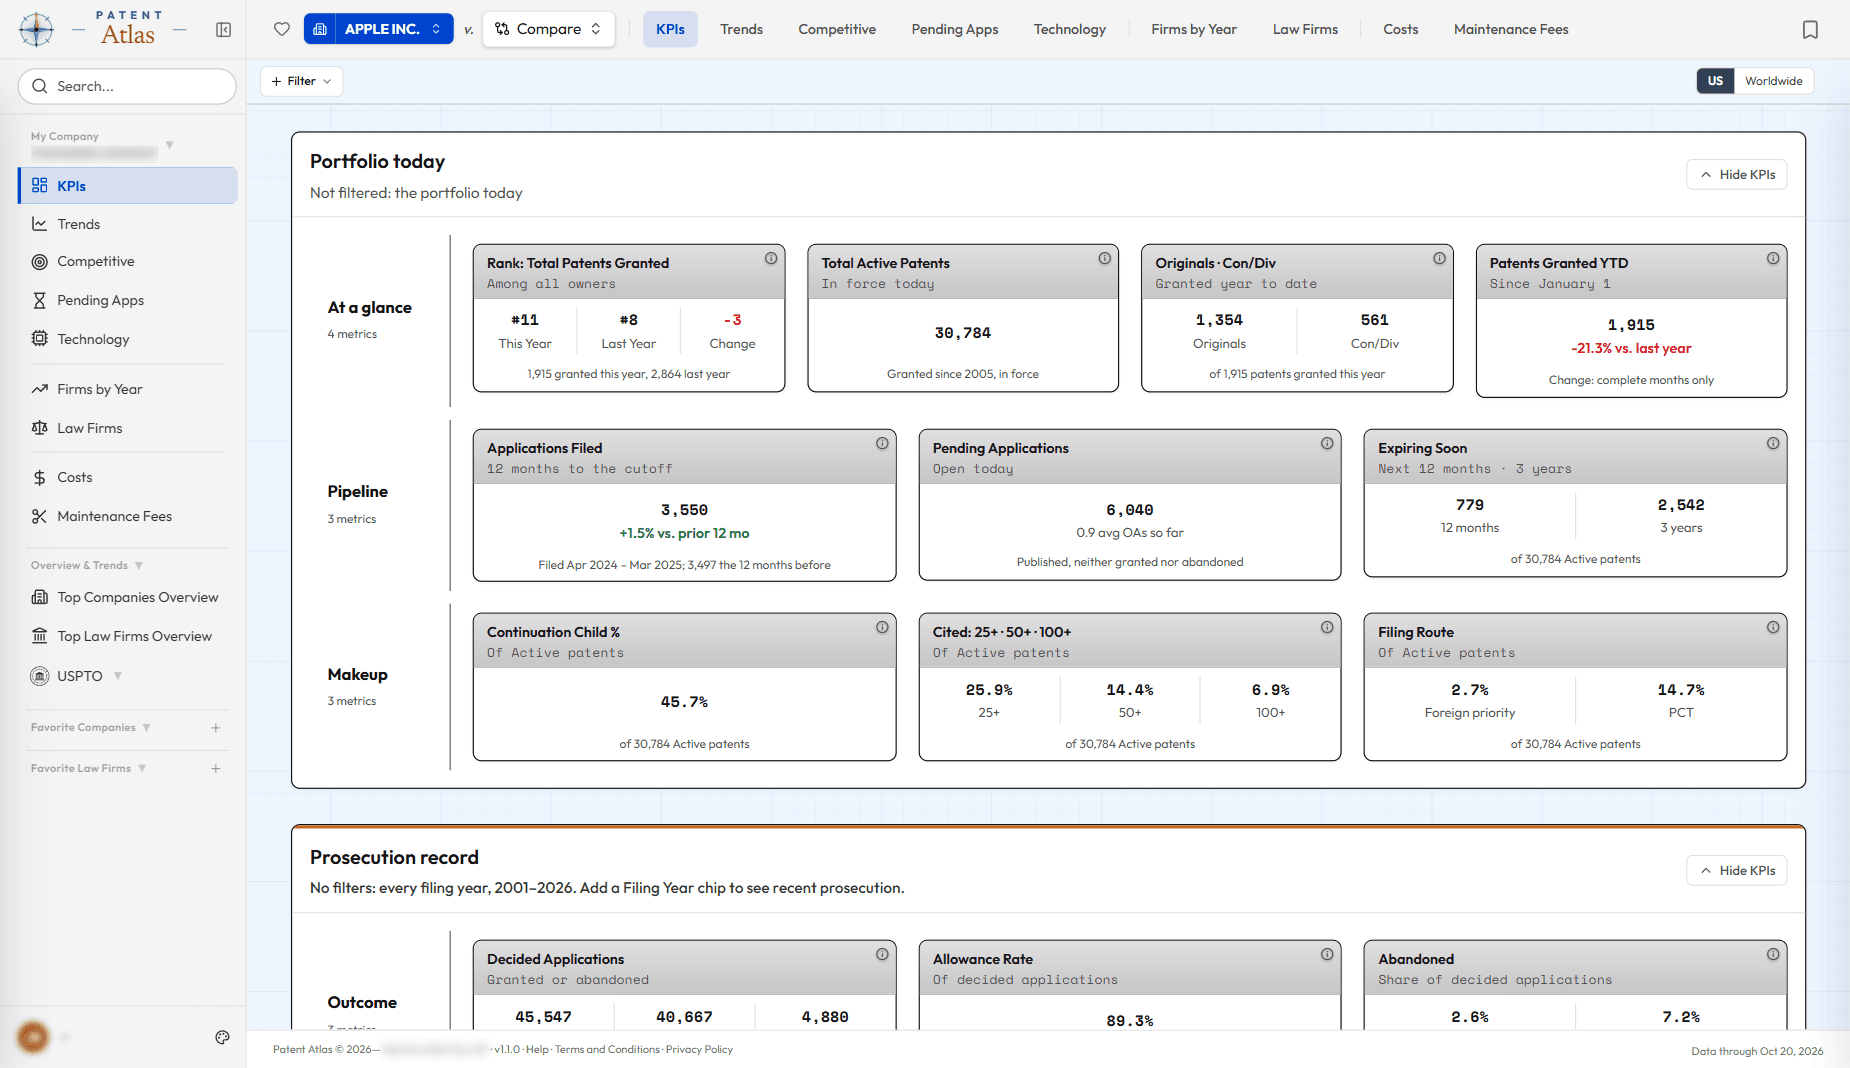
Size up any portfolio against its industry.
Type a company or law firm and read its numbers: active patents, office actions, RCEs and pendency, charted against the average for its technology mix.
- Find where any company or law firm ranks by patents granted or applications filed
- Read office actions, RCEs and pendency per patent against the industry average
- Tell a high office action count from one that is normal for the technology
- Follow a portfolio's filings and grants year by year across 52 patent offices
Compare the firms behind the patents, metric by metric.
Put every firm a company uses side by side, rank a company or firm against its peers, and shade each figure against the USPTO average for the same art units.
- Line up every firm a company uses, with the leader on each metric called out
- Rank a company or firm against its peers on patents, applications and allowance rate
- Shade every figure against the USPTO average for the same art units
- See each peer's share of every technology area worldwide, and where yours is thin
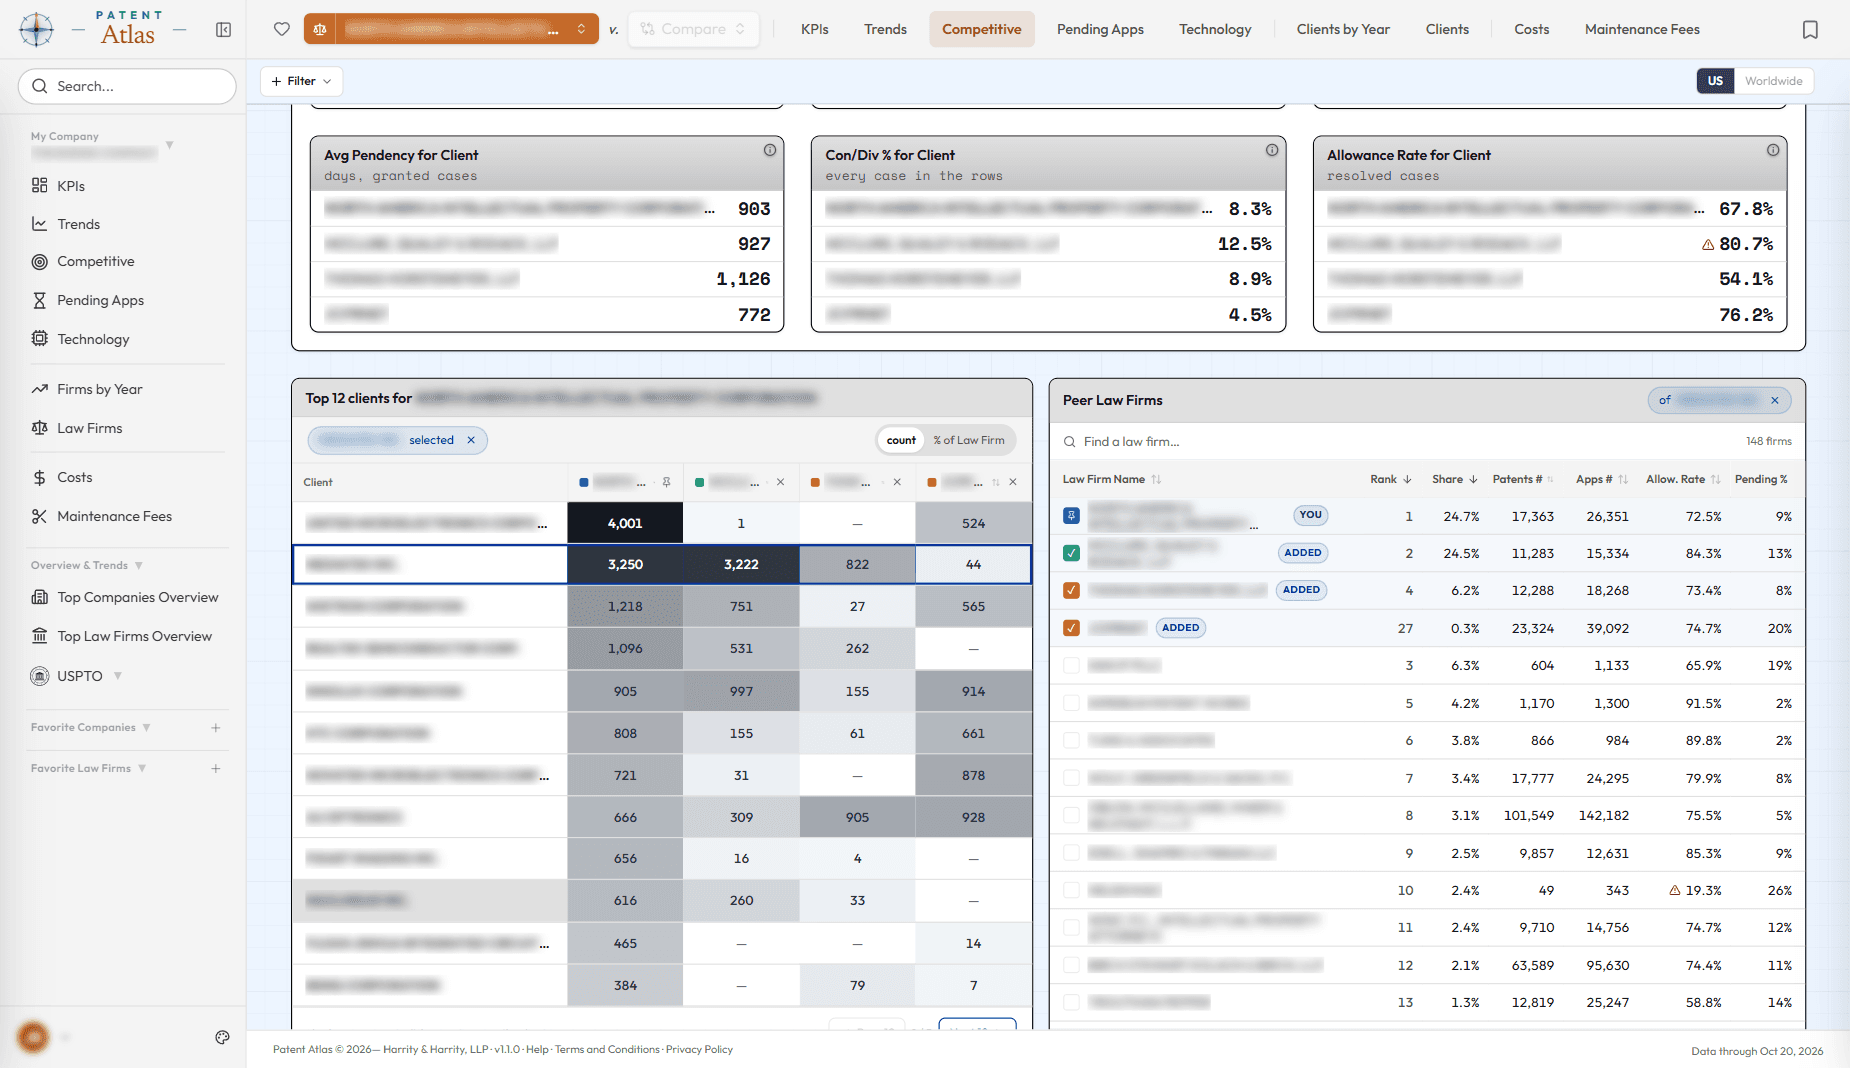
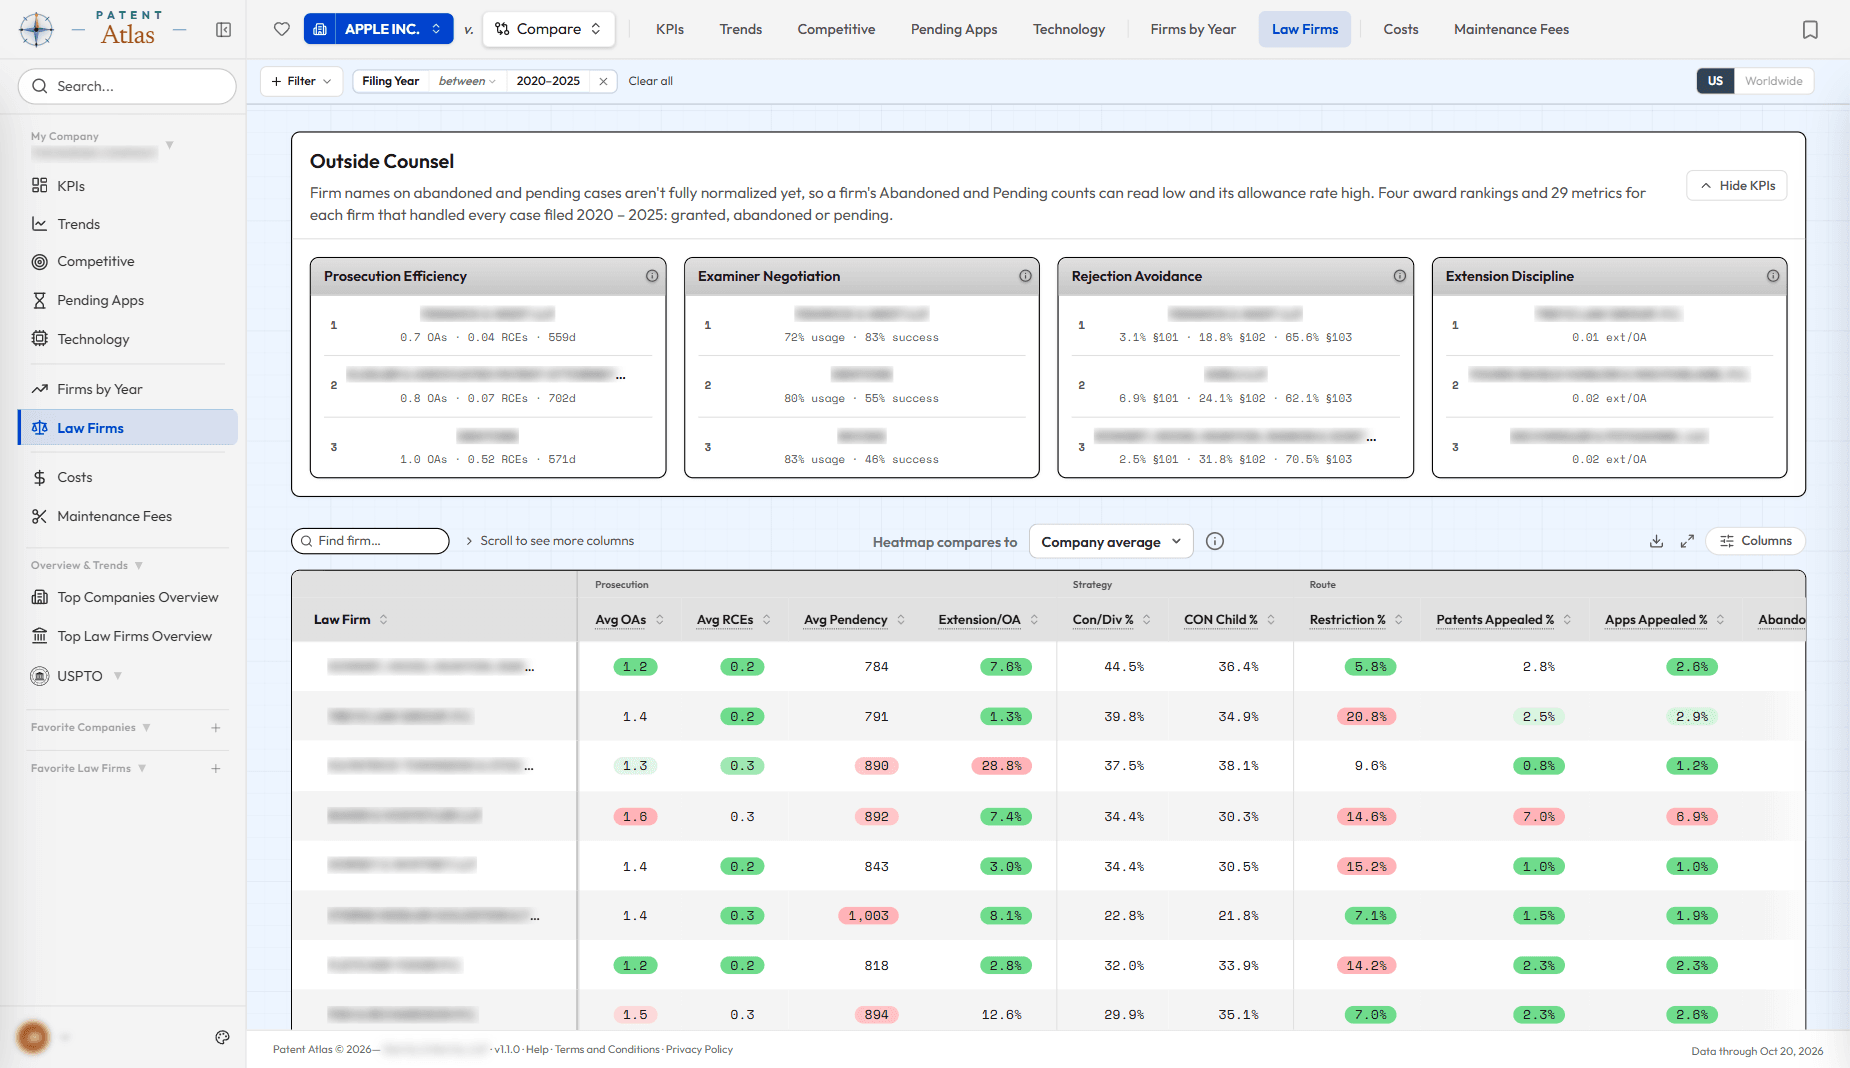
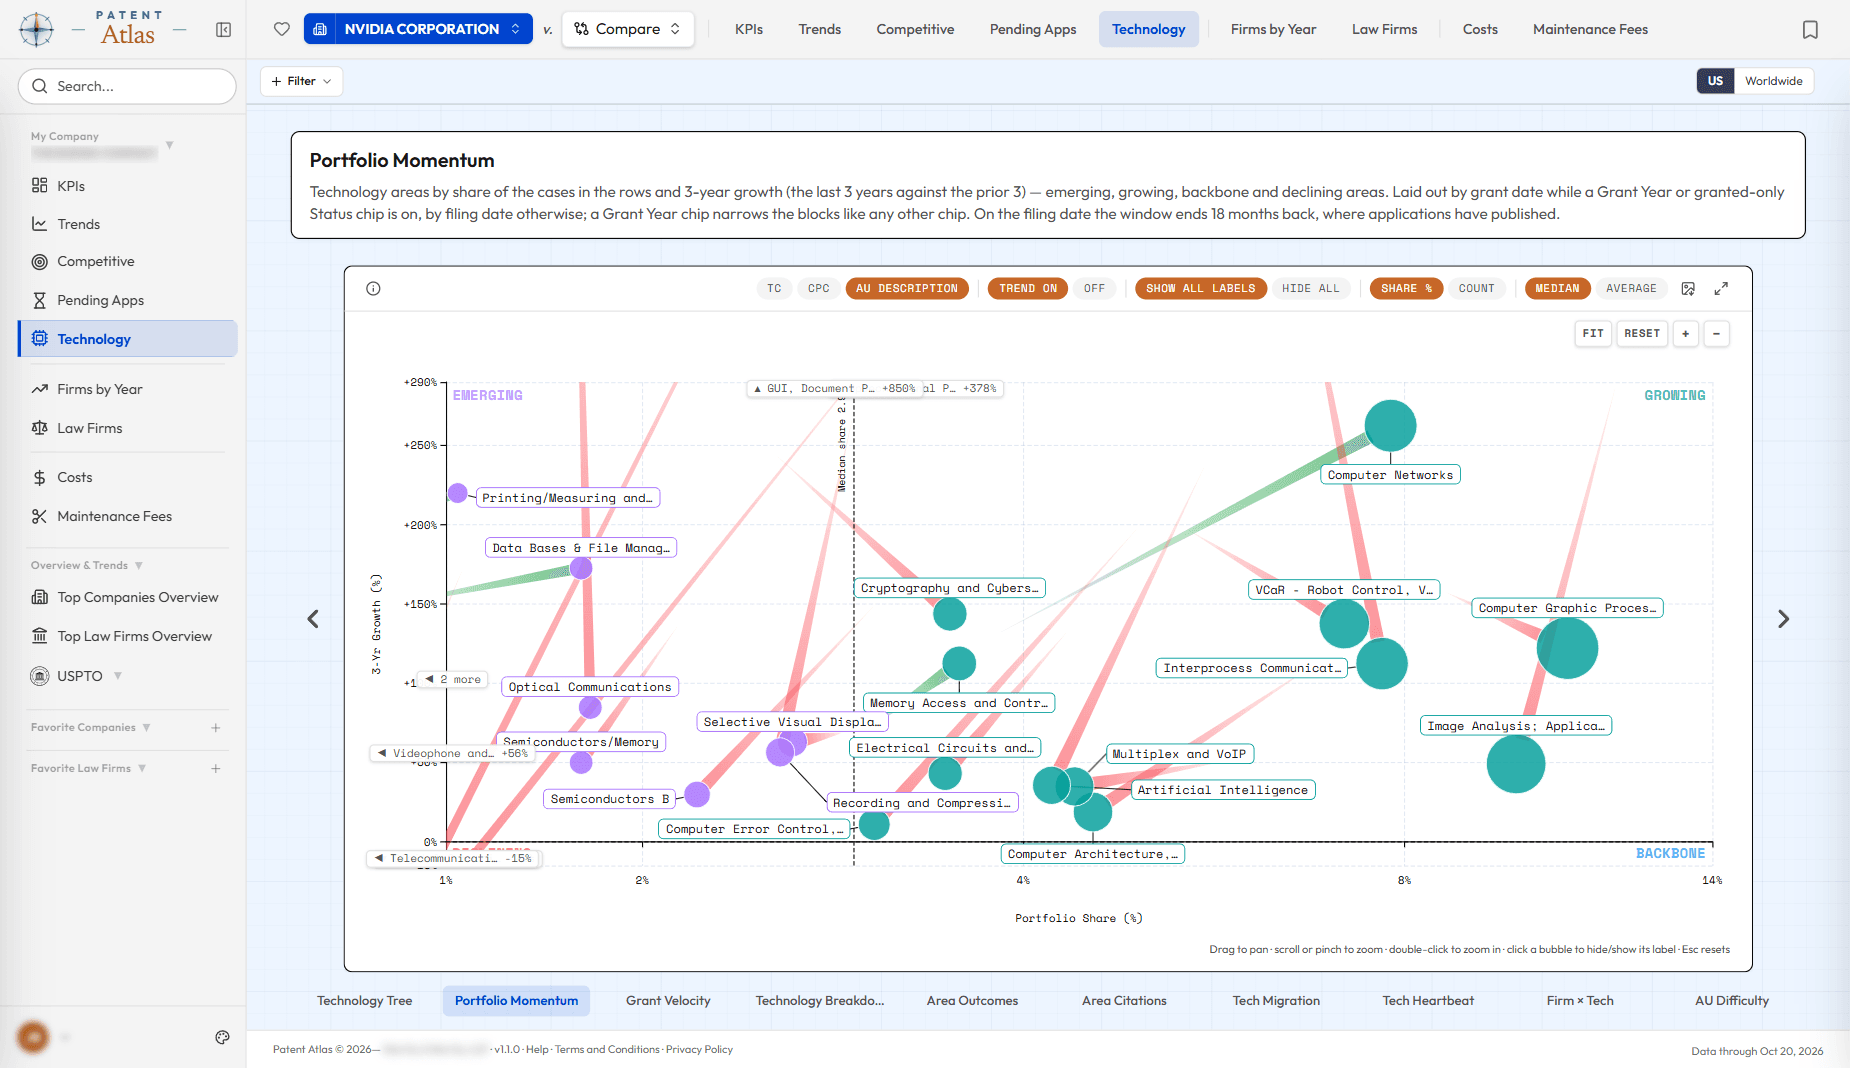
Chart a portfolio by technology: what grows, what fades, who files it.
View any portfolio through CPC subclasses, Tech Centers, art units and patent offices to see where its activity is heading and which law firms handle each area.
- Plot every technology area by its share of the portfolio and its three-year growth
- Watch grants in each technology area climb or fall year by year
- Learn which law firms handle each technology area for a company
- Split each area's applications into granted, pending and abandoned
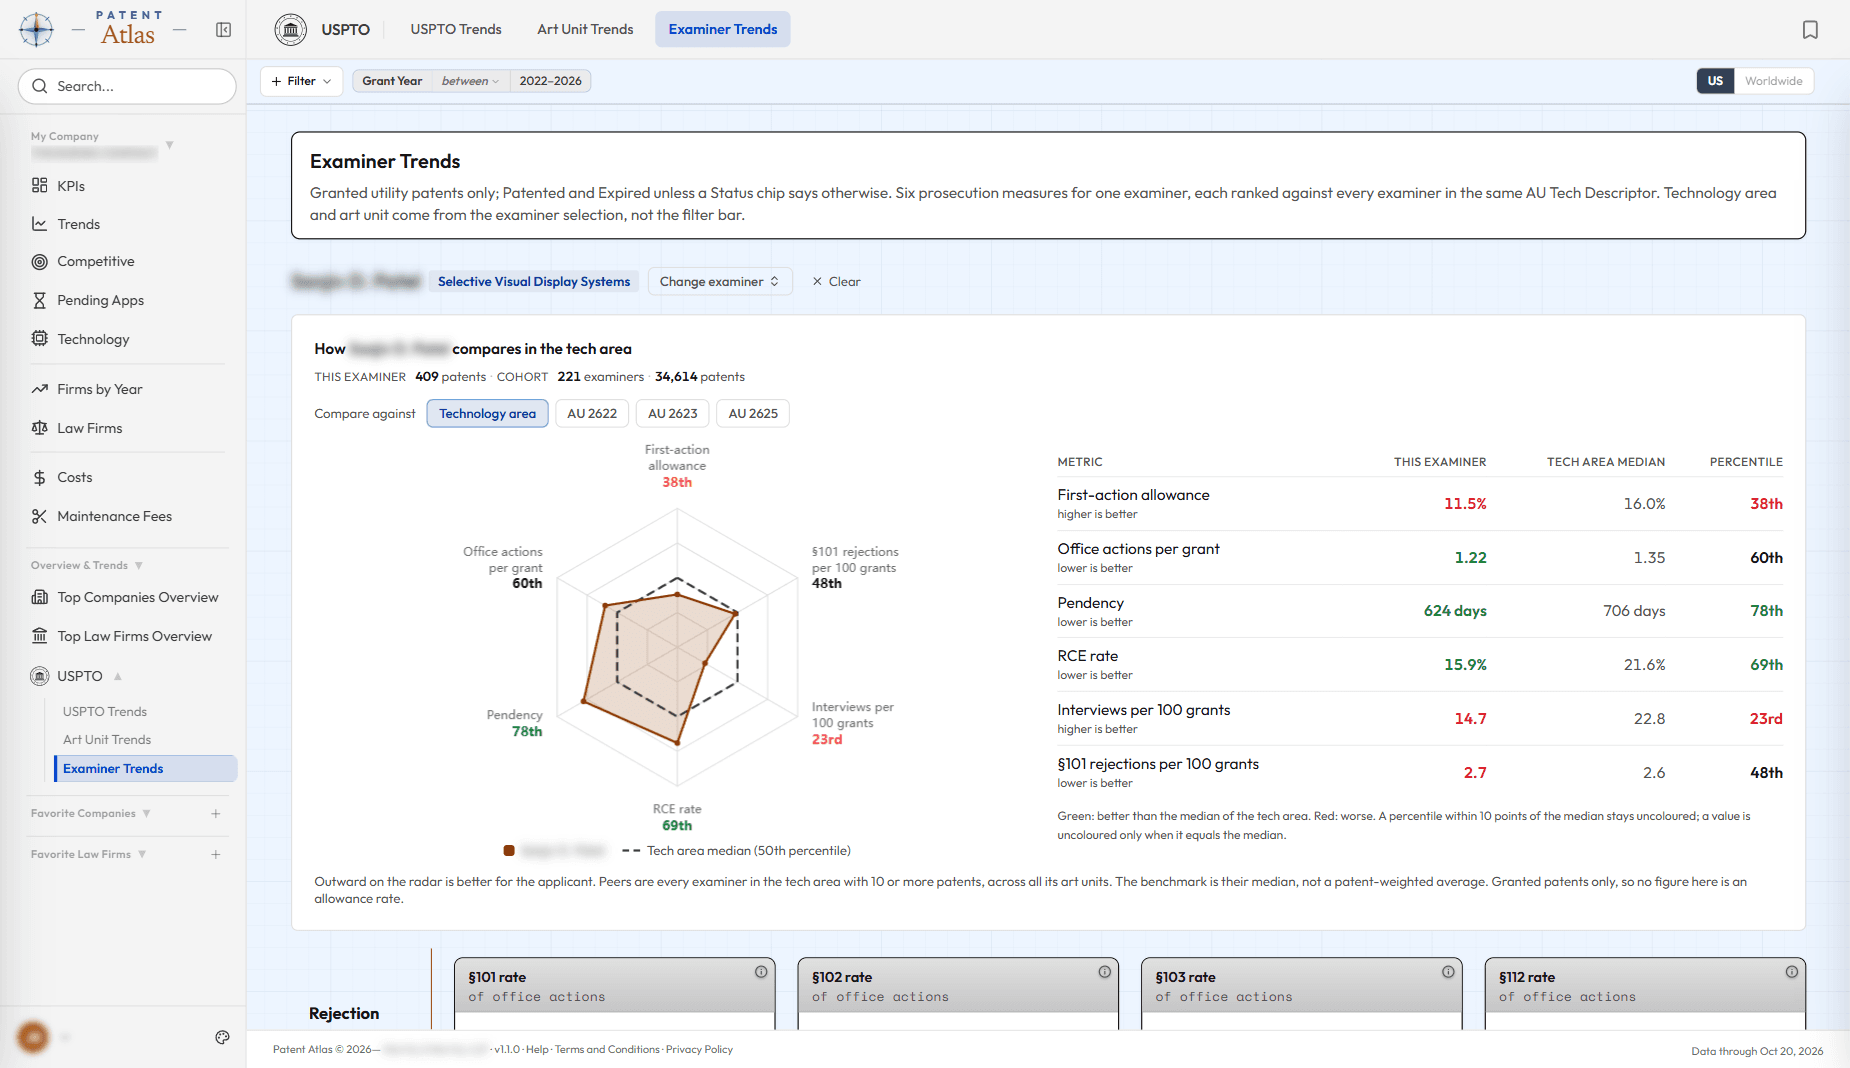
Read the USPTO's own trends, from the whole office down to one examiner.
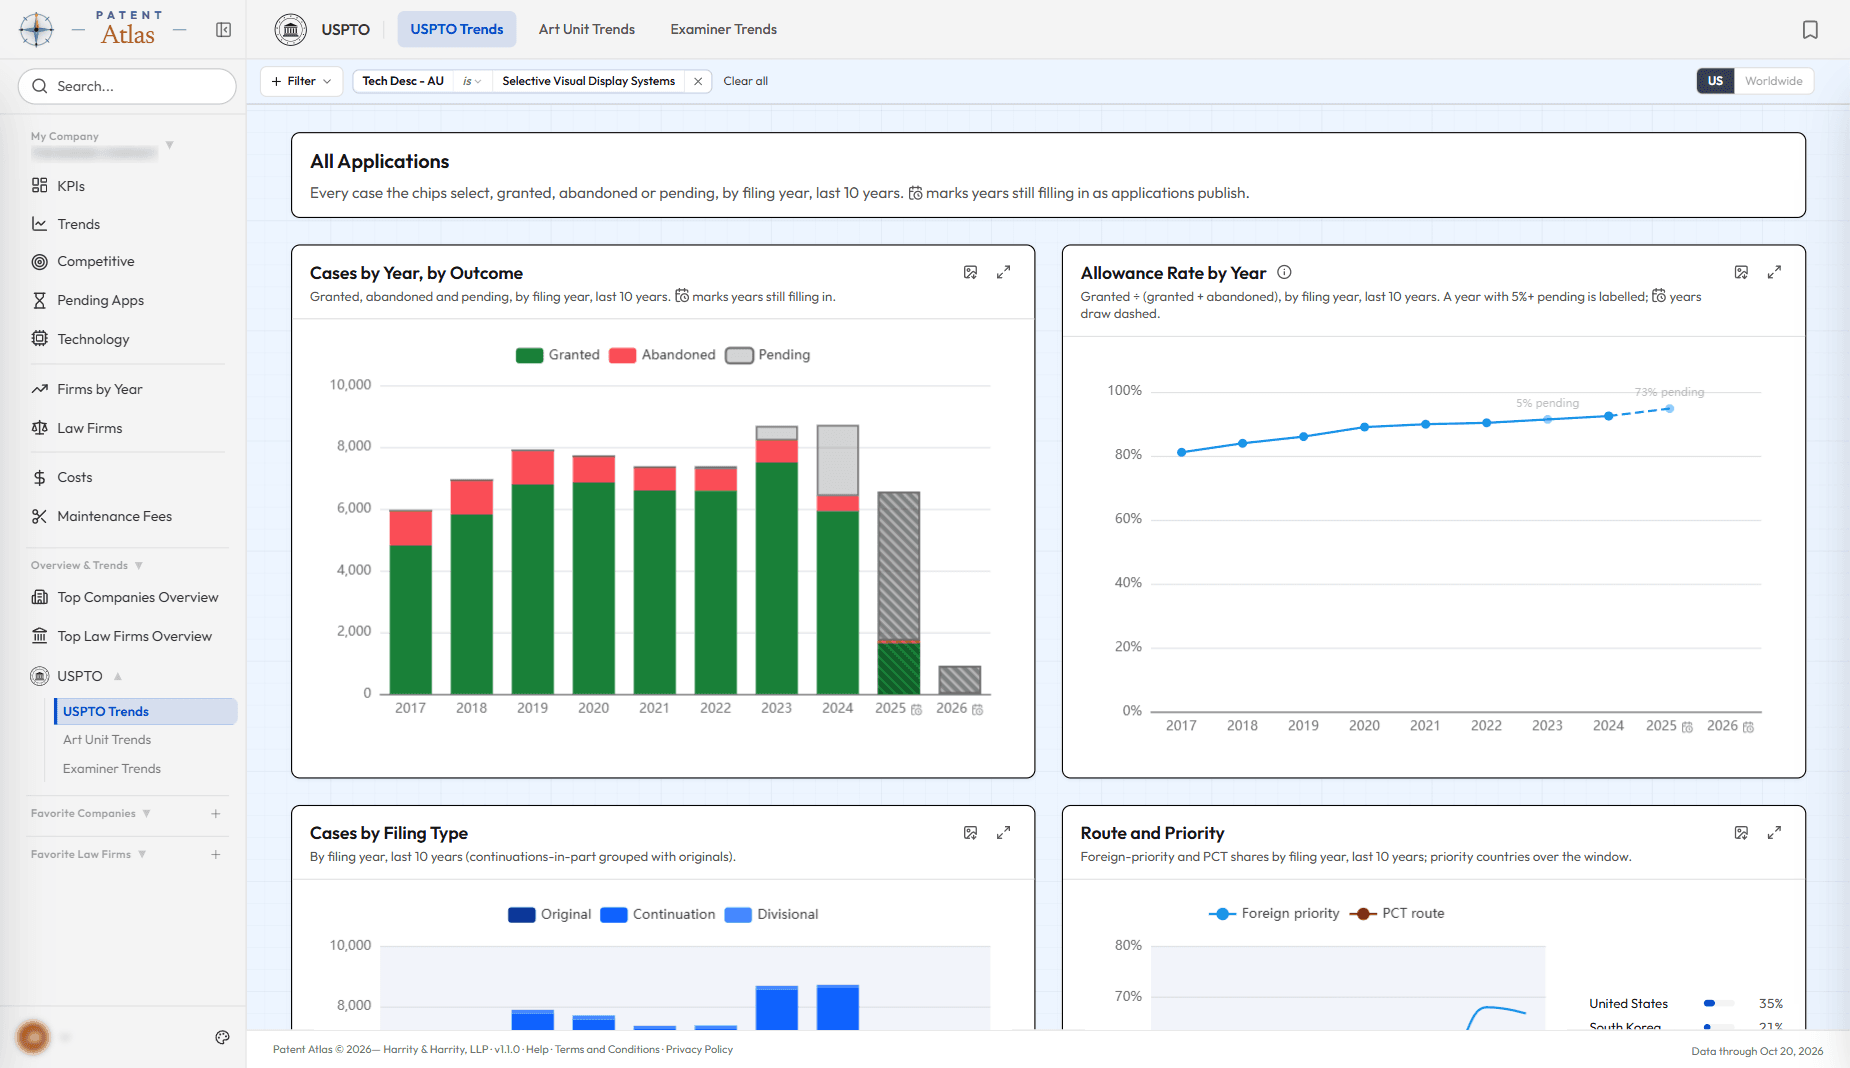
Track how filings, allowance rates, office actions and claims move across the office each year, compare art units, and rank any examiner against every peer in the same technology.
- Track filings, allowance rates and office actions across the office, year by year
- Compare art units on allowance rate, rejections, interviews and pre-appeal success
- Score any examiner against every peer in the same technology on six measures
- Plan a response around how an examiner handles interviews, rejections and appeals
- Patent applications worldwide
- 57 million+
- Patent offices, plus PCT
- 52
- US applications since 2001
- 8.9 million+
- US patent owners and applicants
- 830,000+
- Law firms
- 28,000+
- Data refresh
- Weekly
The metrics you already track, for any company, firm, technology, examiner or patent office.
Worldwide view
Switch any company to Worldwide and follow it into 52 patent offices: filings, grants, time to grant at each office, family coverage and PCT routes. Law firms see where their clients file abroad.
Pending Applications
Track the pending US docket of any company or firm: how many applications, how old they are, and the office actions and RCEs so far, by law firm or by client.
KPIs
See any portfolio's active patents, pending applications, office actions, RCEs and pendency, plus allowance, restriction and appeal rates beside the rate for all applicants.
Law Firms and Clients
Compare every firm a company uses on allowance rate, office actions, RCEs, §101 rejections, interview success, extensions and abandonments.
Competitive
Rank a company or firm against its peers by patents or applications, with allowance rate, pendency and Con/Div share beside each, then compare their shares of every technology area.
Technology
See where a portfolio is growing and where it is fading by CPC subclass, Tech Center and art unit, with each area's grants, abandonments and citations.
Examiner and Art Unit Trends
Pick an examiner and see how they rank against peers in the same technology on office actions, interviews, appeals and pendency.
Costs and Maintenance Fees
Estimate what any portfolio costs to prosecute at your own rates, and see its maintenance run rate, lapse rate and fees coming due.
Industry benchmarks
Find the industry average for any portfolio, so you know whether a high office action or RCE count is worth acting on or normal for the technology.
From Harrity & Harrity
Patent Atlas is produced by Harrity & Harrity, LLP, a patent prosecution firm. Each metric has one written definition, shown and shared across every page.
Your research, saved
Keep filters as you move between pages, save filter sets, bookmark any view and favorite the companies and firms you follow.
Sign up today for an instant, free 7-day trial.
- 01
Sign up with your work email
Company and law firm addresses only. Free-mail addresses are not eligible.
- 02
Confirm the code we email you
- 03
Use the full product for 7 days
Every page, every filter, every export.
After the trial, go month to month at $250 or save with annual at $2,400 a year.